Background
In a fiercely competitive product segment, a medical device manufacturer faced an uphill battle. Speed to market was paramount. This manufacturer’s dilemma was how to rapidly scale production to beat competition to market while transitioning from manual assembly to automation. Automation NTH provided the automation equipment to enable fast deployment and high-volume production.
Automation NTH developed and deployed an innovative automation architecture and systematically de-risked the automation program using simulations, digital twins, and proof of principles. The result was the design, build, and installation of multiple complex assembly machines within a short timeframe.
Challenges
After the NTH machines were installed in the manufacturer’s clean room, the focus shifted to optimizing production throughput. Many challenges remained:
- The manufacturer lacked enough qualified personnel with relevant technical experience
- The supply of raw materials was severely constrained as their suppliers ramped up production. This put pressure on optimizing the machine’s yield to minimize the waste of a scarce resource.
- Technical issues related to custom equipment installations
Approach
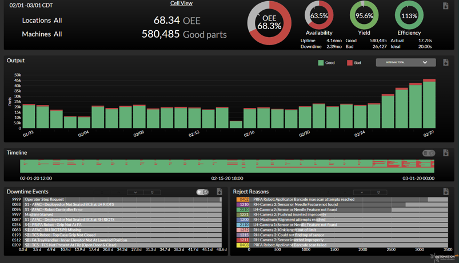
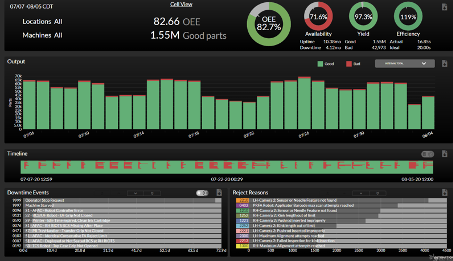
Automation NTH’s Customer Success Organization is dedicated to supporting and optimizing equipment after it’s installed at customer facilities. In response to our customer’s production ramp challenges, the Customer Success Organization birthed a “Pareto Busters” initiative. Drawing insights from the Pareto Charts and other visuals on the OEE Optimizer® dashboards, the team was able to focus on the leading causes of machine downtime, yield loss, and cycle delays. This data-driven method fostered targeted, rapid, and effective interventions.
Armed with this data and intimate knowledge of the equipment, Automation NTH and the customer met regularly for 3 months to develop and implement optimization strategies. During the meetings, the engineering teams would present their recommended approach to improve the machine performance. After each meeting, the teams developed software changes, updated the code repository, wrote test and validation plans, and executed test cases. Using one machine as a test environment, the collaborative team developed and deployed 41 software and hardware changes including 22 PLC updates, 7 HMI updates, 7 robot updates, and 2 vision job file updates.


Outcomes
Due to the dedicated performance optimization efforts by the Pareto Busters team, OEE was improved in all areas:
- Machine availability increased by 8 percentage points
- Average Cycle Time improved, dropping from 17.7 seconds to 16.8 seconds
- Yield rates rose by 2 percentage points
Most significantly, the manufacturer discovered an unexpected bonus: they needed less equipment than anticipated due to the improved machine performance. Now, with 28 assembly machines in production, they consistently achieve 95%+ OEE.
Automation NTH’s extensive knowledge of the equipment and processes, along with dedicated support staff in the Customer Success Organization, were vital to the initiative’s success.
